Freeze-Drying Examples
HOME > Freeze-Drying Examples
TOKYO RIKAKIKAI CO., LTD.
888-693-9352
EYELA as a pionner of Evaporators
HOME > Freeze-Drying Examples
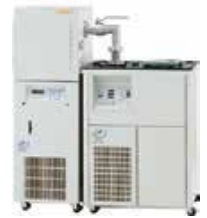
Models used
(No. 1)
Freeze dryer
FDU-2110 +
Drying chamber
DRC-1000
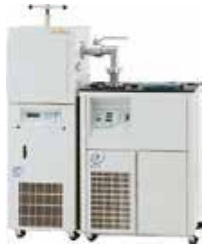
Models used
(No. 2)
Freeze dryer
FDU-1110 +
Drying chamber
DRC-1100
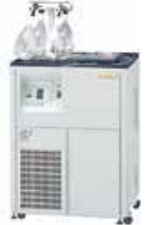
Models used
(No. 3)
Freeze dryer
FDU-1110 +
Flask manifold
PMH-4
The experiments are conducted according to the following procedures.
Pre-freezing
Pre-freezing stage to freeze the samples in advance. The samples are sufficiently frozen using a low-temperature bath, freezer, or dry ice. Generally, pre-freezing is performed at temperatures between -80°C and -30°C. This is a critical pretreatment step that determines the success or failure of the freeze-drying process.

Primary drying
Drying frozen samples under high vacuum. Sublimation begins at the sample surface and proceeds at the boundary with the dried layer inside. Sublimation occurs gradually over an extended period.

Secondary drying
Removing bound water as a finishing step. After primary drying, the sample is heated to approximately 30°C (depending on the sample) under high vacuum to enhance the drying process.
| Samples | Weight | Recovery rate | Shelf temperature | Models used | ||
| Before drying | After drying | Primary drying | Secondary drying | |||
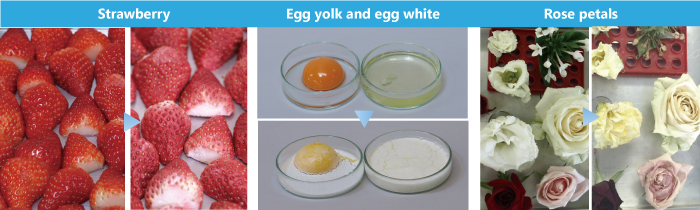
| Strawberry (20 pcs) | 255.2g | 25.6g | 10.0% | -10℃ | 20℃ | No. 1 |
| Banana (3 pcs) | 155.7g | 38.3g | 24.6% | |||
| Pineapple | 479.4g | 70.3g | 14.7% | |||
| Mango (halved) | 118.1g | 18.3g | 15.5% | |||
| Avocado (1 pc) | 70.3g | 22.5g | 31.9% | |||
| Cherry tomatoes (20 pcs) | 259.6g | 21.4g | 8.3% | |||
| Egg yolk (4 pcs) | 74.8g | 34.2g | 45.8% | |||
| Egg white (4 pcs) | 154.0g | 18.1g | 11.8% | |||
| Milk (180mL) | 187.6g | 25.8g | 13.8% | 15℃ | No. 2 | |
| Bacon | 123.3g | 42.7g | 34.6% | |||
| Acerola juice | 1600.6g | 146.9g | 9.2% | Room temperature (RT) | No. 3 | |
| Samples | Weight | Recovery rate | Shelf temperature | Models used | ||
| Before drying | After drying | Primary drying | Secondary drying | |||
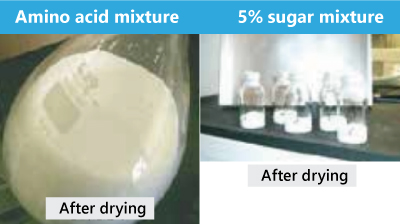
| Amino acid mixture | 333.9g | 9.9g | 3.0% | RT (20 to 23℃) | No. 3 | |
| 5% sugar mixture | 135.4g | 112.4g | 83.0% *1 | -15℃ | 20℃ | No. 2 |
| Active pharmaceutical ingredients (Moisture content approx. 80%) | 3982.6g | 819.0g | 20.6% | -10℃ | 15℃ | |
| Liposomal lipids | 1.98g | 0.14g | 7.07% *1 | -20℃ | 5℃ | No. 1 |
| Pharmaceutical intermediates | 247.3g | 24.8g | 10.0% | -10℃ | 15℃ | |
*1: Recovery rate values include the vessel mass.
| Samples | Weight | Recovery rate | Shelf temperature | Models used | ||
| Before drying | After drying | Primary drying | Secondary drying | |||
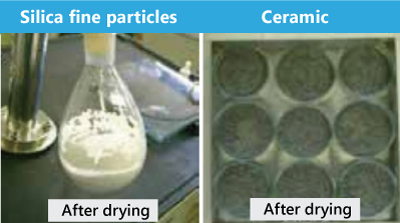
| Ceramic, Glass | 150.2g | 56.9g | 37.8% | RT (20 to 23℃) | No. 3 | |
| Silica fine particles | 135.3g | 36.4g | 26.9% | |||
| Aluminum oxide, Silicon dioxide, Slurry | 508.5g | 42.3g | 8.3% | -10℃ | 20℃ | No. 2 |
| Ink | 30.4g | 11.4g | 37.5% *1 | -10℃ | 20℃ | No. 1 |
| Dielectric mixture slurry | 289.7g | 59.9g | 20.7% | |||
| Ceramics | 225.2g | 10.4g | 4.6% | -10℃ | 20℃ | No. 2 |
*1: Recovery rate values include the vessel mass.